


28 Oct CASE STUDIES
In this article we are going to perform a brief overview of real situations, in which GPS Logistic can help us to manage the fleet more efficiently. For the purpose, we will check few examples, which have proven to be more common in our practice.
Example 1: “The driver says, that he is on his way to the address, but the system shows the vehicle on another place.” In order to be 100% sure in the truth value of the statement of the driver, we have to check the current status of the vehicle in GPS Logistic – in this case: on the picture below.
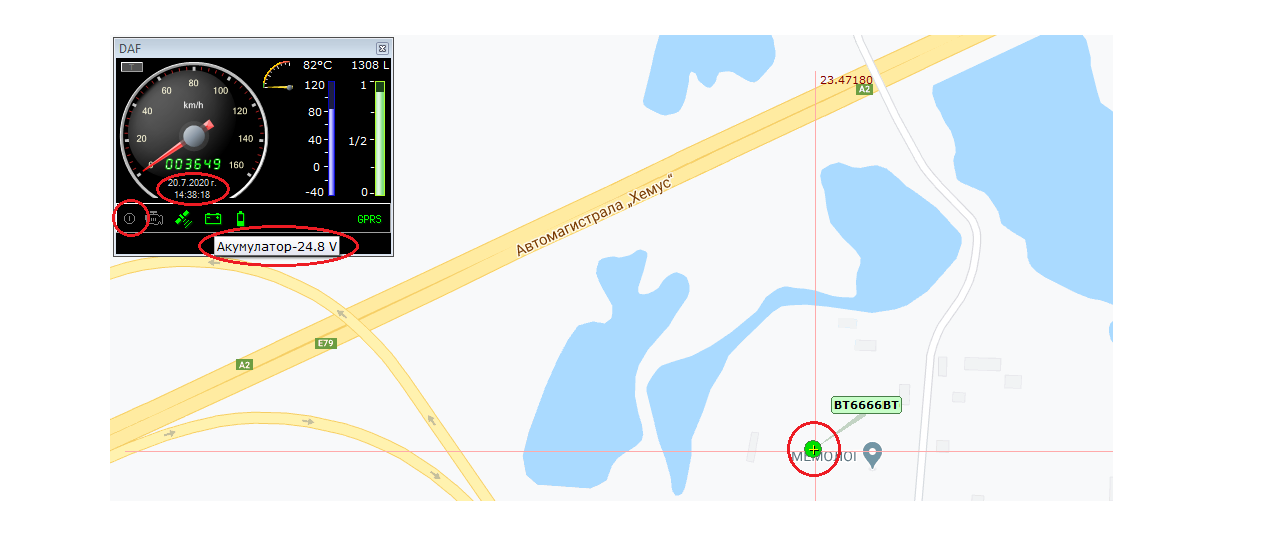
The picture shows, that the vehicle is at place, without ignition key on, with valid GPS coordinates, current date and hour and in addition – the level of the car battery suggests, that the engine is not working. In this case we can be sure, that the vehicle is static at the moment.
Example 2: “We have received a fine for speeding for vehicle X for date 12.06.2019 at 11:43, can we see which driver was operating the vehicle at that time?” The answer to this question is – yes, if there is an additional module for driver identification installed to the standard GPS hardware. We have to generate a report for the vehicle movement (history) for a past period – about the date, which the respective fine concerns. The example is again in the picture below.

In this case, we see that on the specific date the vehicle was operated by driver with initials T.Y. This is also the only driver, which has been operating the vehicle on that date and the speed, measured around the hour of the fine is vizualized in the dashboard.
Example 3: “Our excavator was rented for some part of December. Can we see how many hours it has been working, since the payment will be made on the basis of its usage?” Here the system offers a solution – in a table view we can see the required information. The sample picture is again under the text.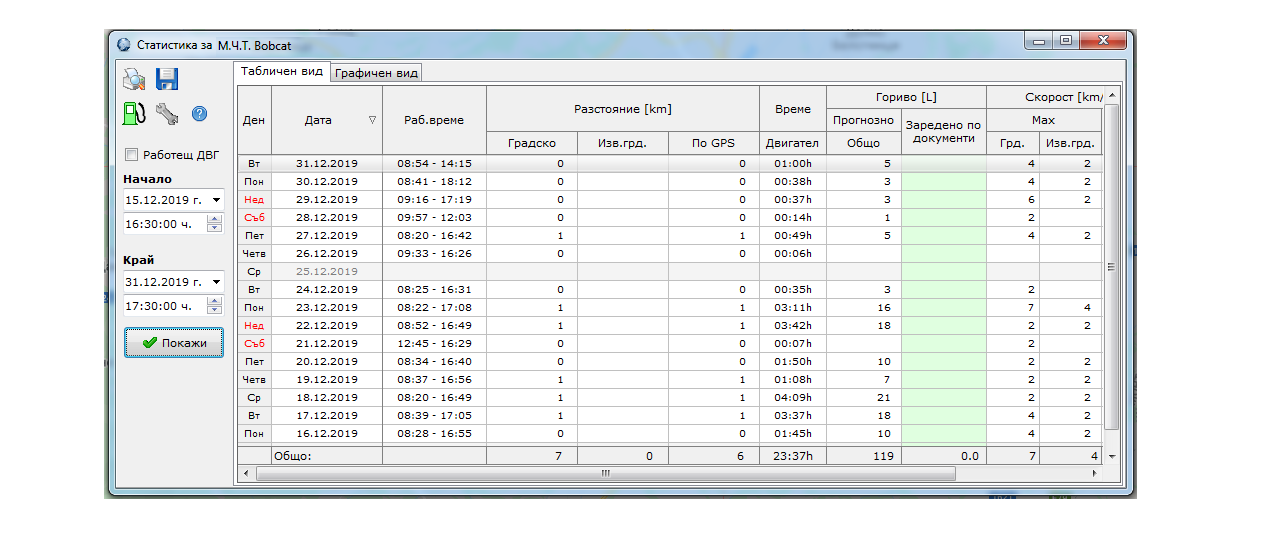
In this case we can see exactly for how many hours the machine had been working, according to the generated report. The situation is similar if we want to see a report about the motion (traveled distance) for a truck or for a car. Based on the additional equipment, that is installed in the vehicle – in the generated report we can see other details, as what is the fuel consumption of the vehicle, according to the onboard computer, for how many hours has the peripheral equipment worked (crane, cooling unit, pump and so on).
Example 4: “I have a suspicion about fuel theft. How can I check this?” If the fuel level sensor in the tank works correctly, (for both vehicles with established connection between the GPS device and the CAN bus and older vehicles, at which the fuel level is measured in an analog data way) the suspicion can be proven or rejected. In the common case, if the vehicle is in motion with X litres fuel in the tank, then stops for a bit, after which it continues its journey with fuel level lower than X litres – we have direct drain from the tank – the system will signalize that with red coloring in the fuel column at the report with the history of the motion of the vehicle (Statistics). Such example can be seen in the pictures below.
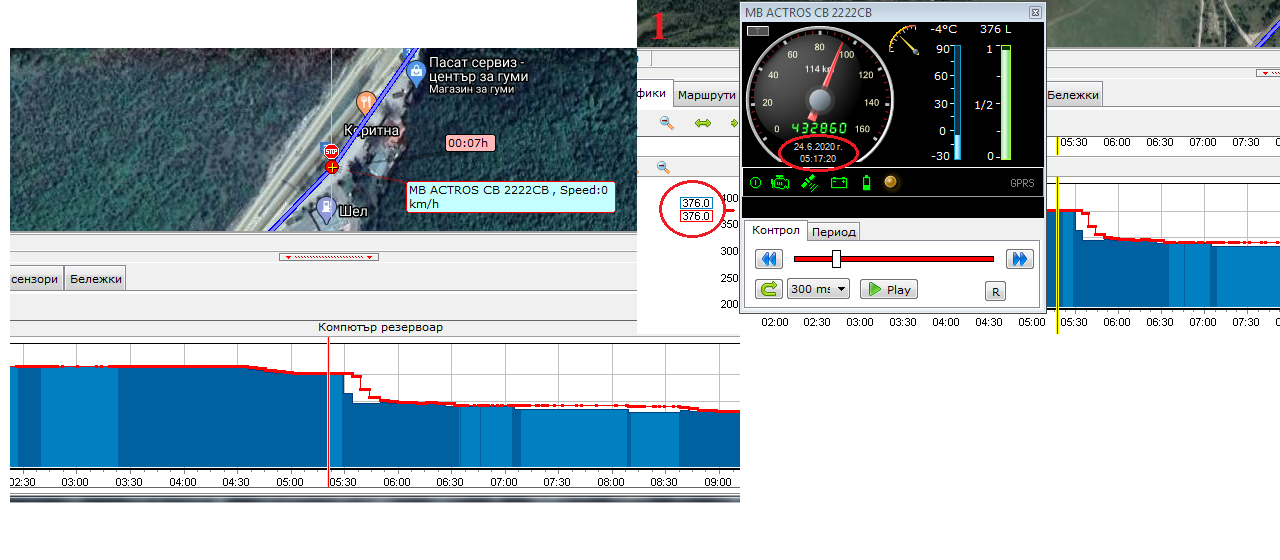
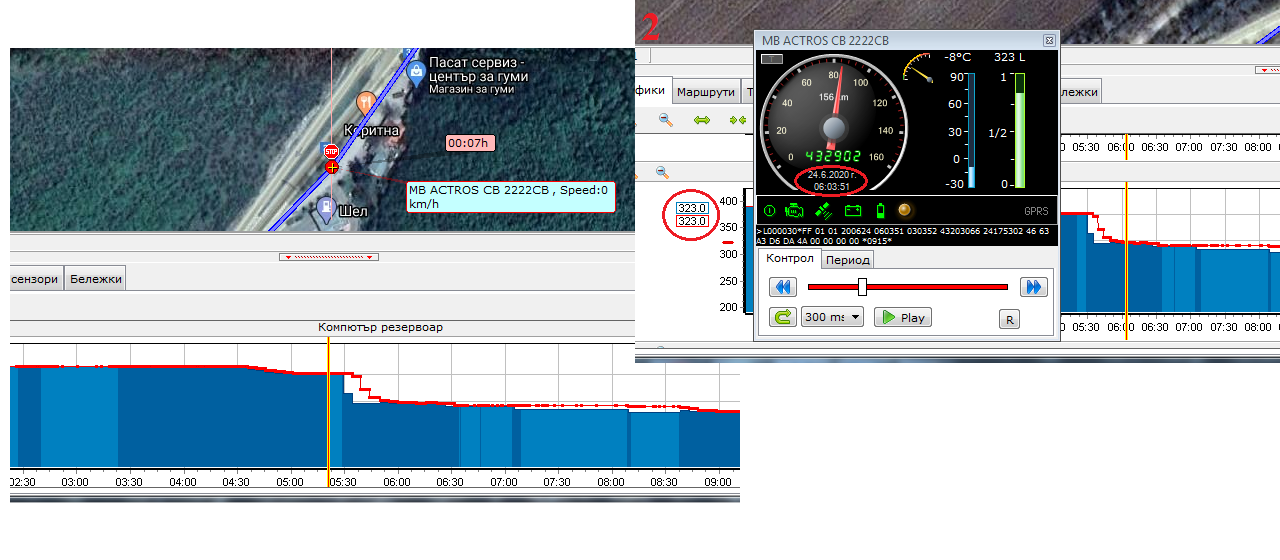
The vehicle stops for 7 minutes on the location from the picture on the left. Before the stop, it has about 376 l. fuel in the tank and after it the fuel level shows 323 l. In this case we have fuel drain from the tank of about 50 l. It is good to have in mind, that fuel thefts are not always so easy to observe, especially when they are for lesser quantities drained. In this situation, however, the fuel drain cannot be disputed.
Example 5: “Our dumper was performing courses from point A to point B for one of our customers. We have to check how many courses were completed, since such report is required in the invoice we will prepare for the customer.” This option is available in GPS Logistic, in case that the user has set the as static objects in the program the points A and B. After that, we can generate a report for the respective vehicle and time period. Such report can be seen below.
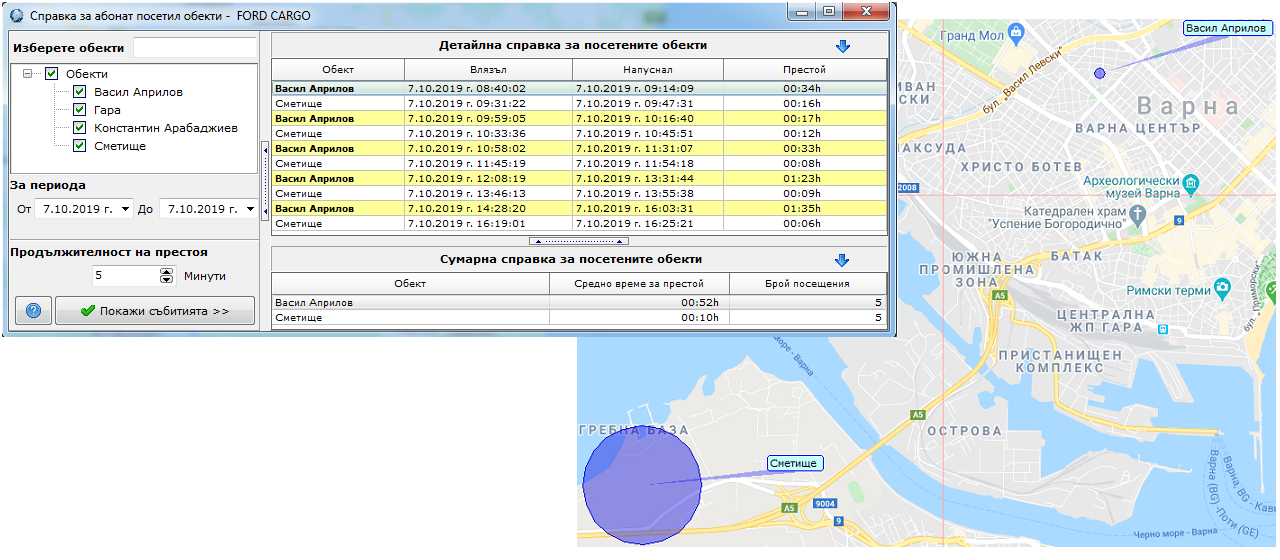
From the query we can see that for the date 07.10.2019 the trips from point A to point B were total of 5. The static objects are shown on the map and the generated report is based on the trace of the vehicle compared to those static geometric figures. Similar reports can be generated for other purposes – e.g. to see how many and which customers have our sales team visited and to check if it has missed some scheduled for visit client.
Example 6: “Is required from me to calculate the driving time of the fleet in Germany for the last month, in order to be able to make wire transfer for social and health security abroad. How can this be performed?” GPS Logistic includes reports for automatic calculation of the driving time of the vehicles in a series of countries – Bulgaria, Germany, Austria, France, England, Hungary, Italy, Netherlands and so on. Such report can be seen below.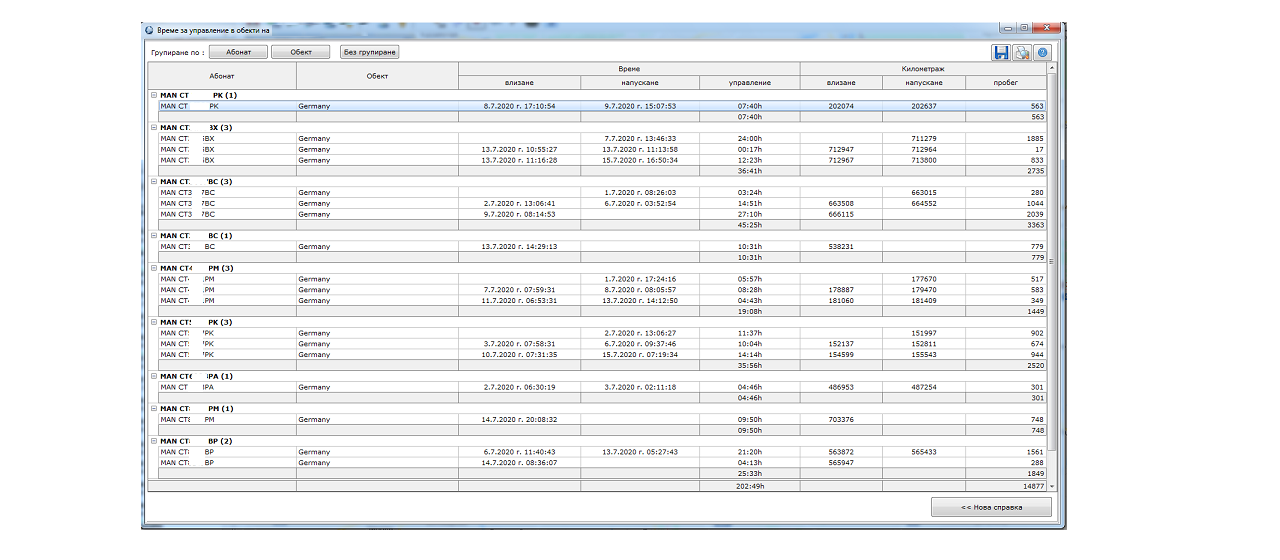
Here we can see the driving time in Germany of the vehicles of company X for a given period of time. The query can be saved as a file or printed on paper for direct audit of the expenses.
Example 7: “Some of our drivers do not stop the engines of the vehicles when they are waiting on an address. This leads to excessive fuel consumption. How can we check if this is the case with a specific vehicle?” The system has an option for measuring the total working time of the engine for each day. This data can be then “broken” in two parts – working time on place and driving time.
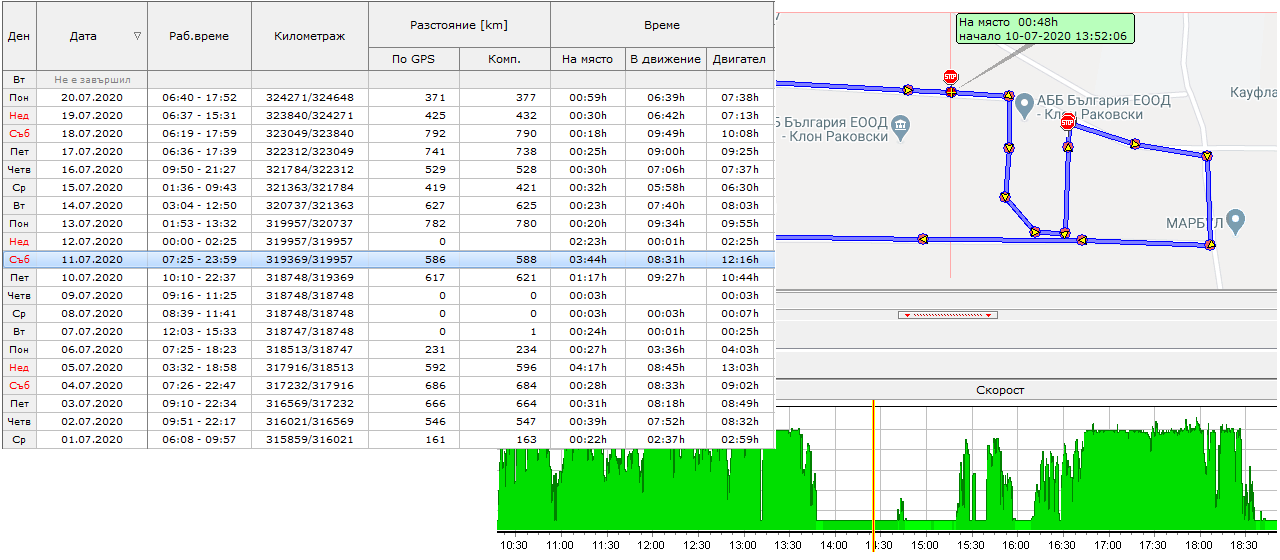
On the picture above we can see a report for the history of a vehicle for a chosen period (Statistics). We also see a part of a specific day, at which longer working time on place has occurred.
For more details and an advice for going through a given situation, you can contact us using the information from the Contacts section.